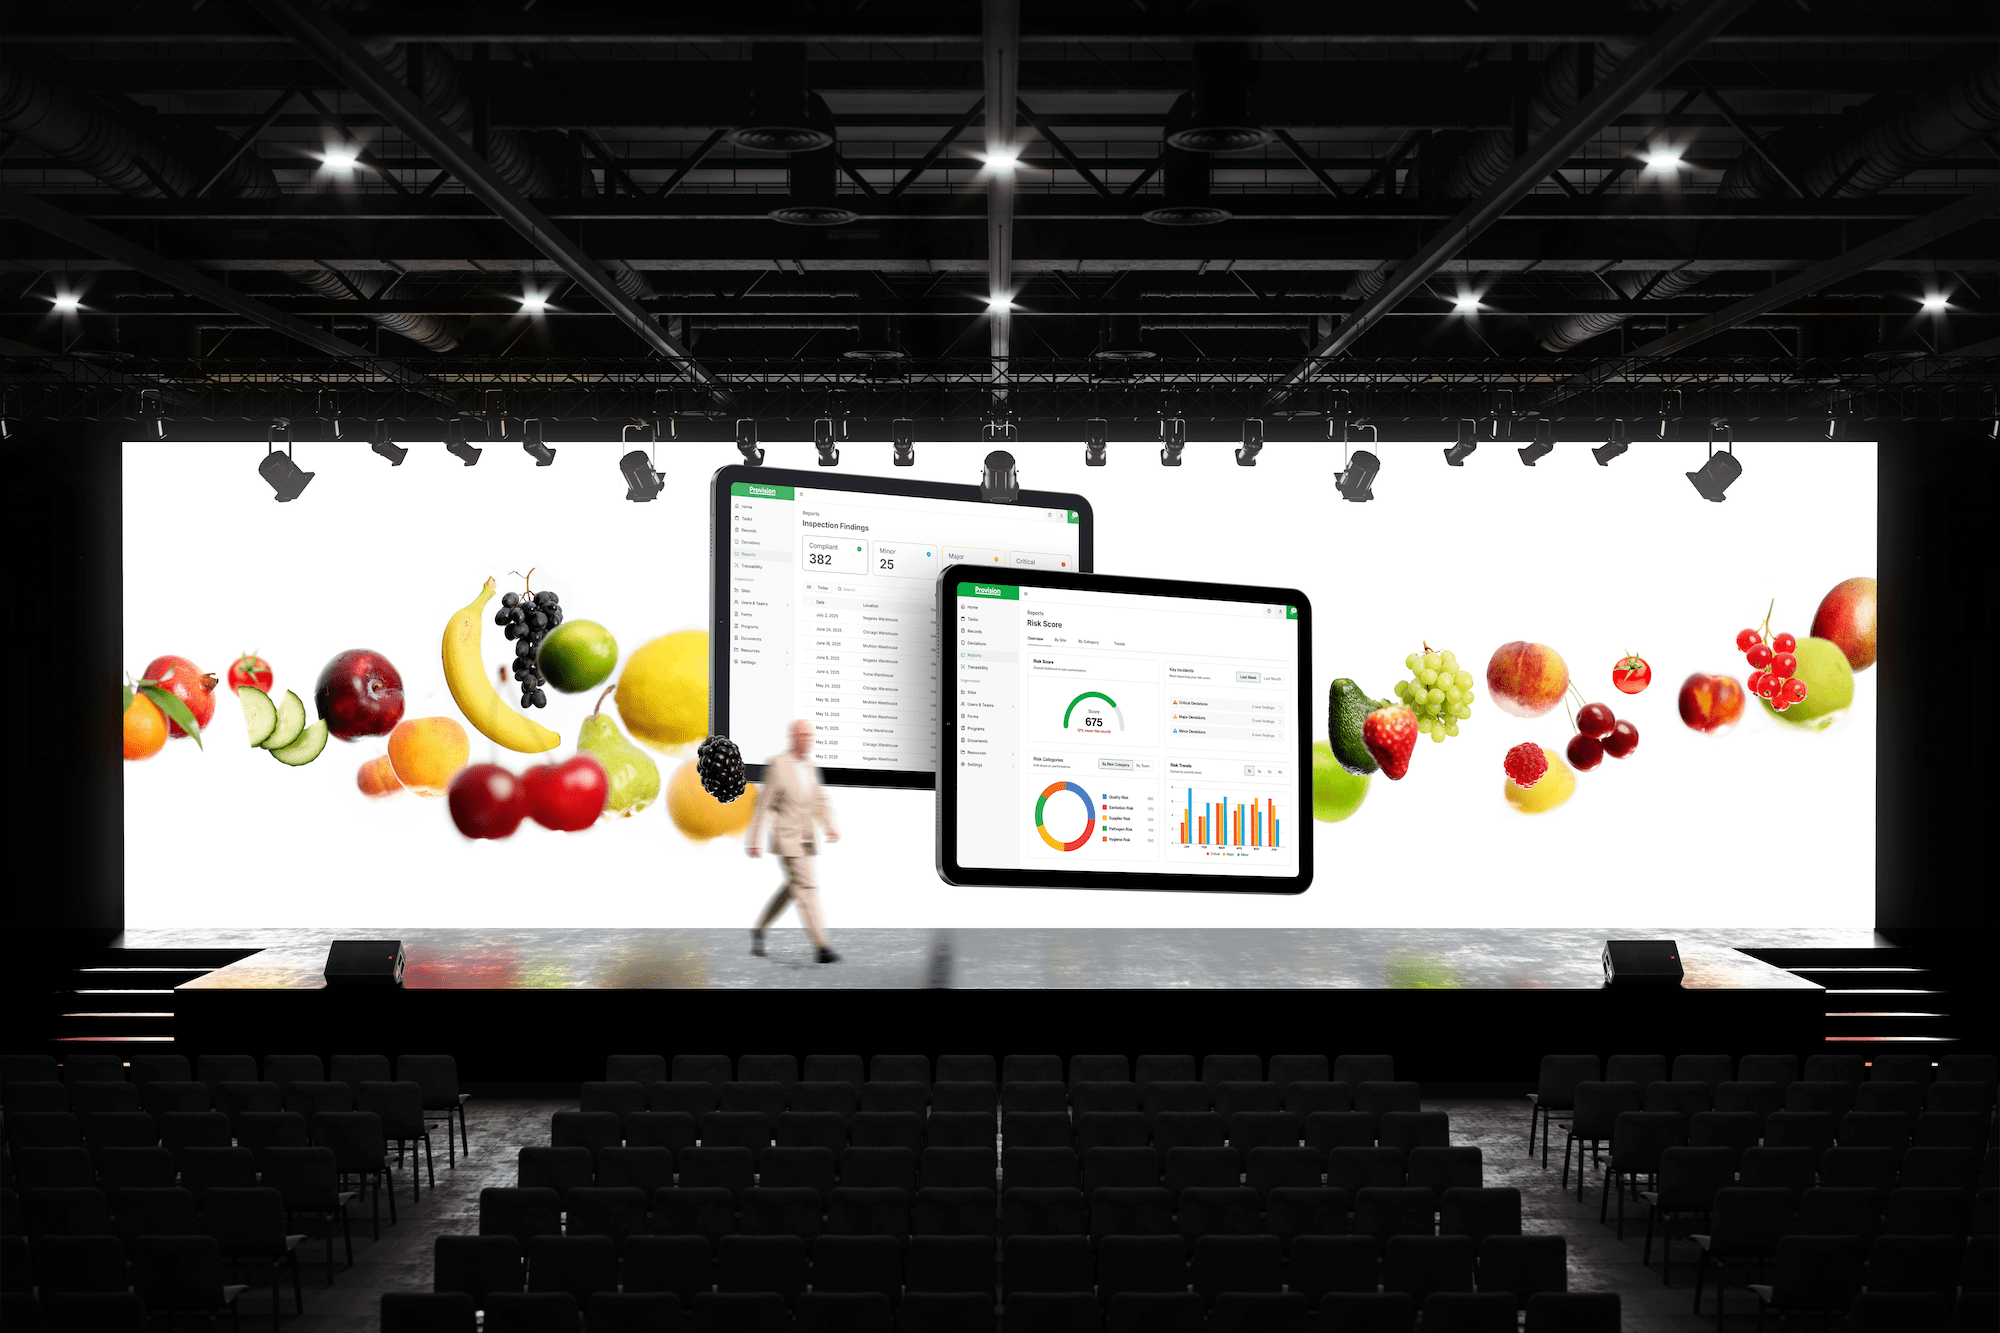
Spreadsheets hide risks. Customizable reporting reveals them, guiding teams and proving impact instantly.
Faster detection
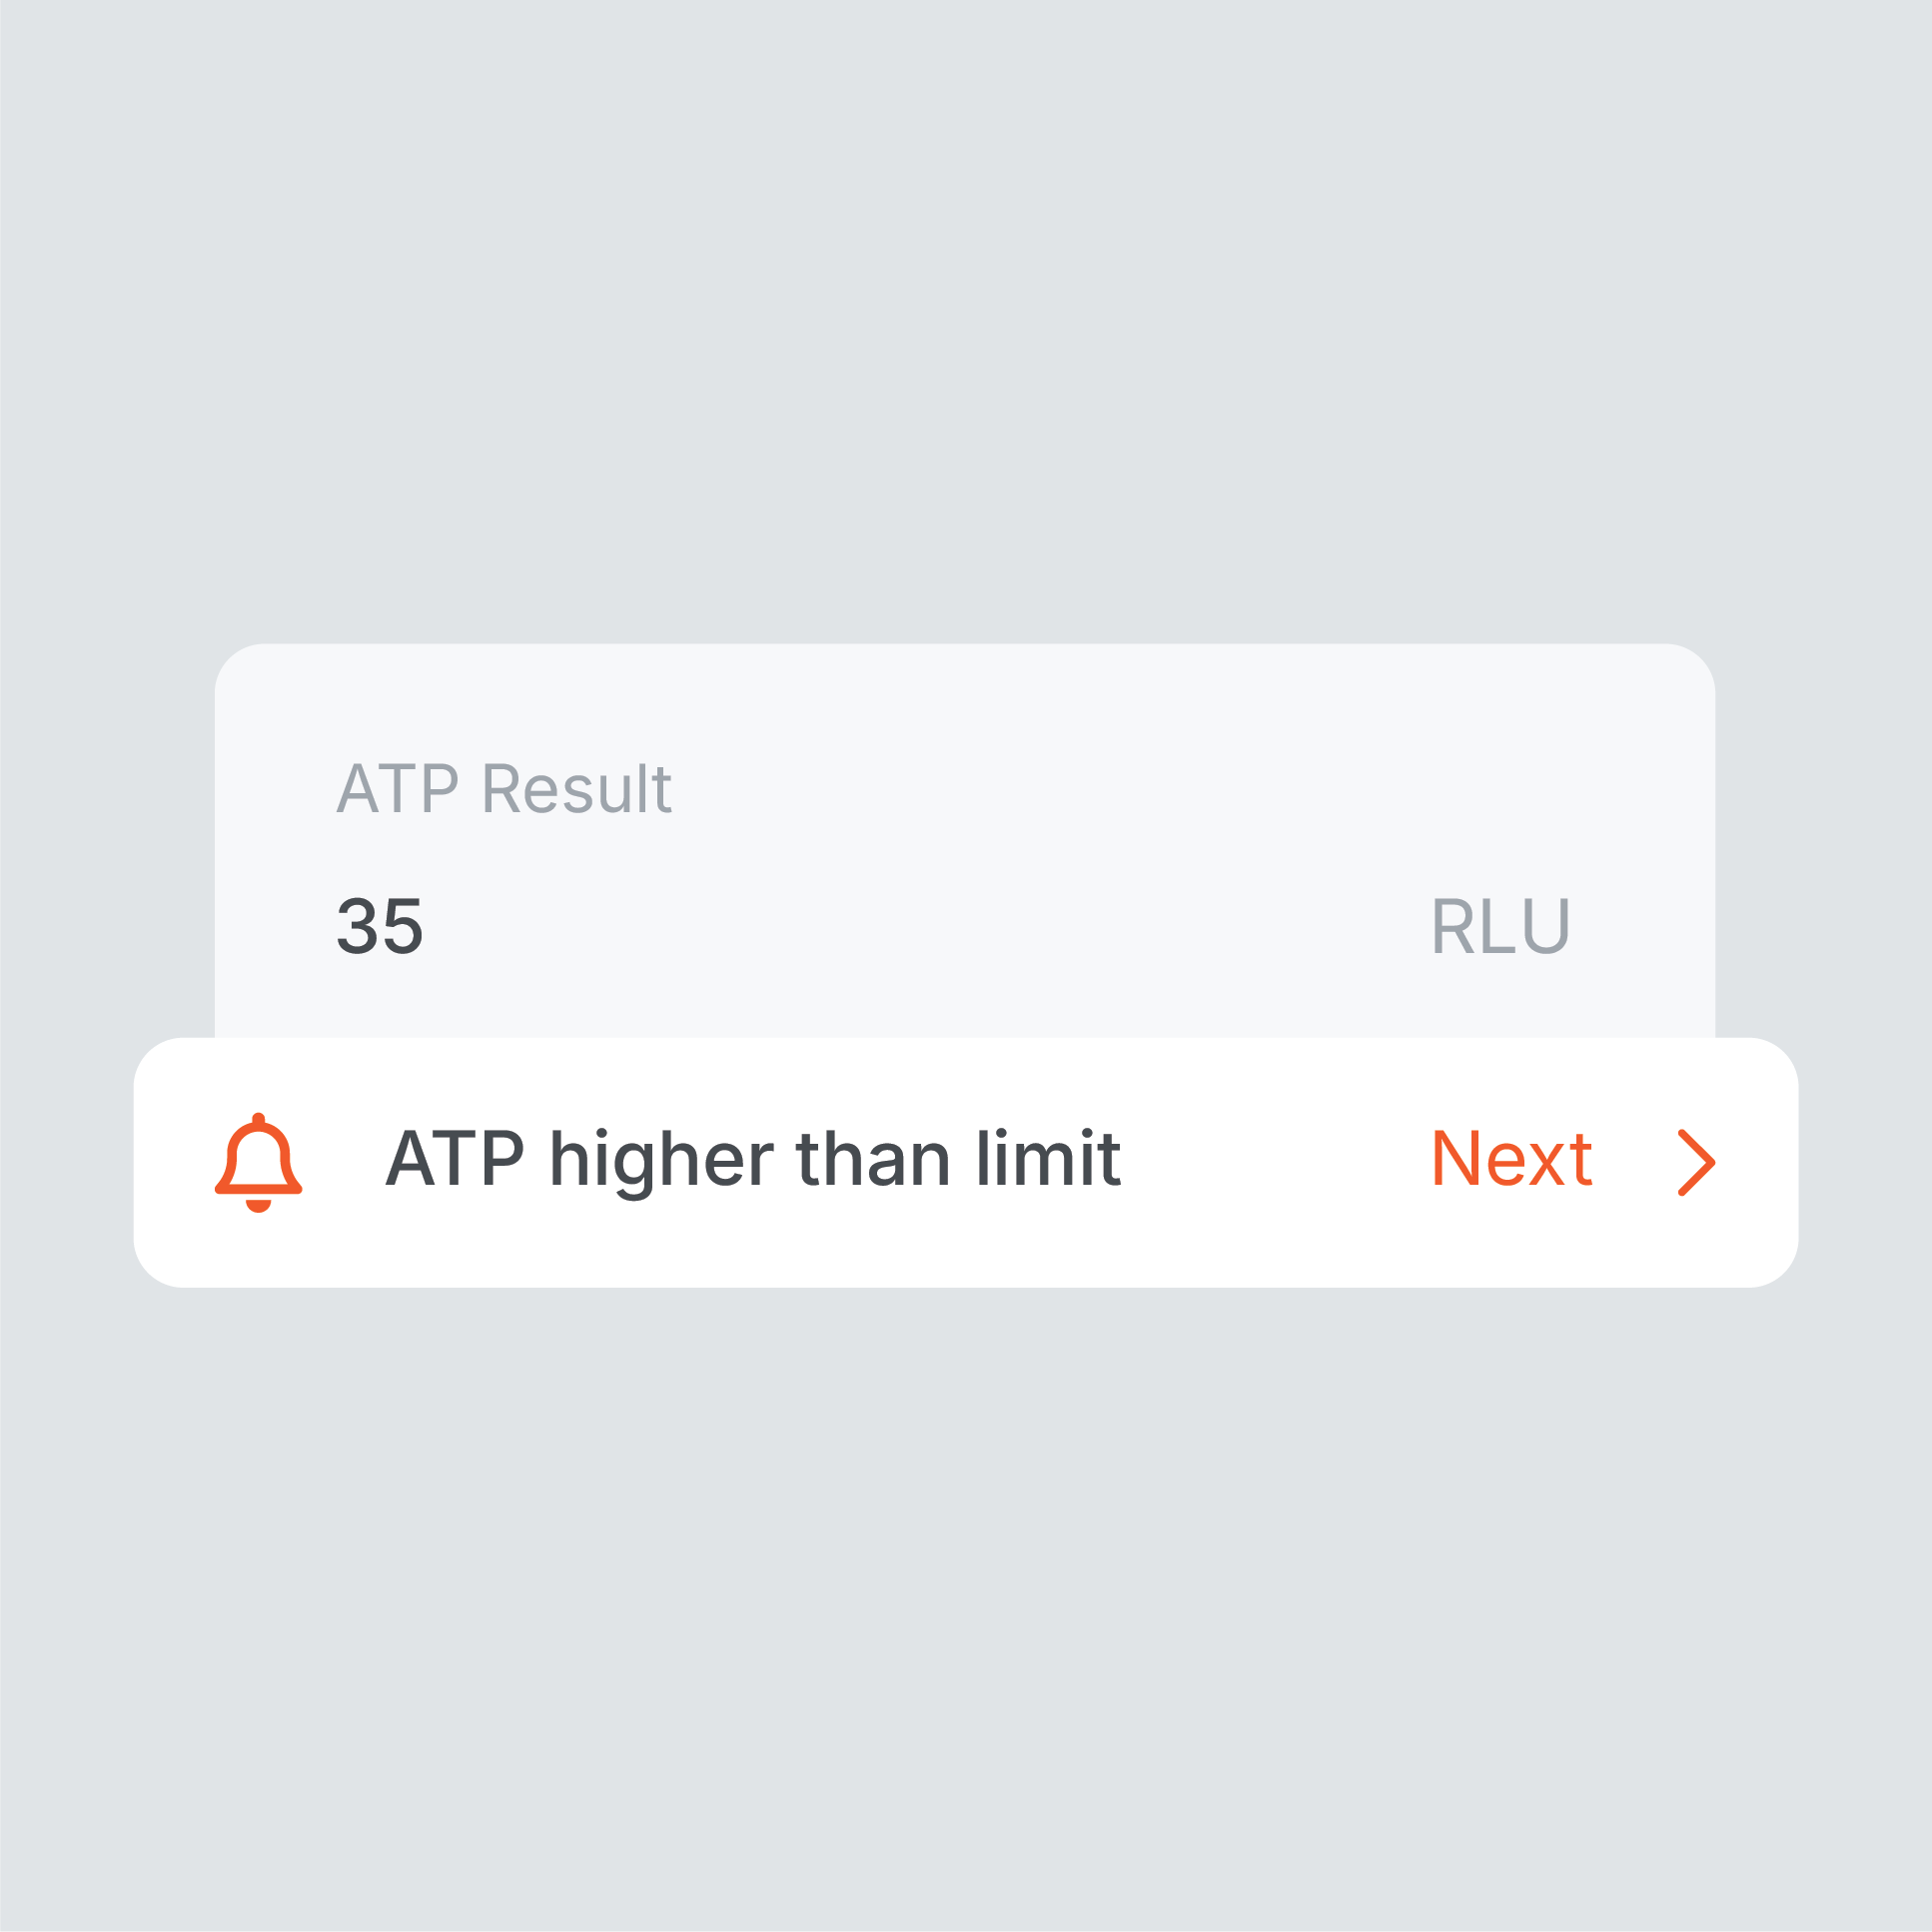
Live reports refresh with every record submission
Better investigations
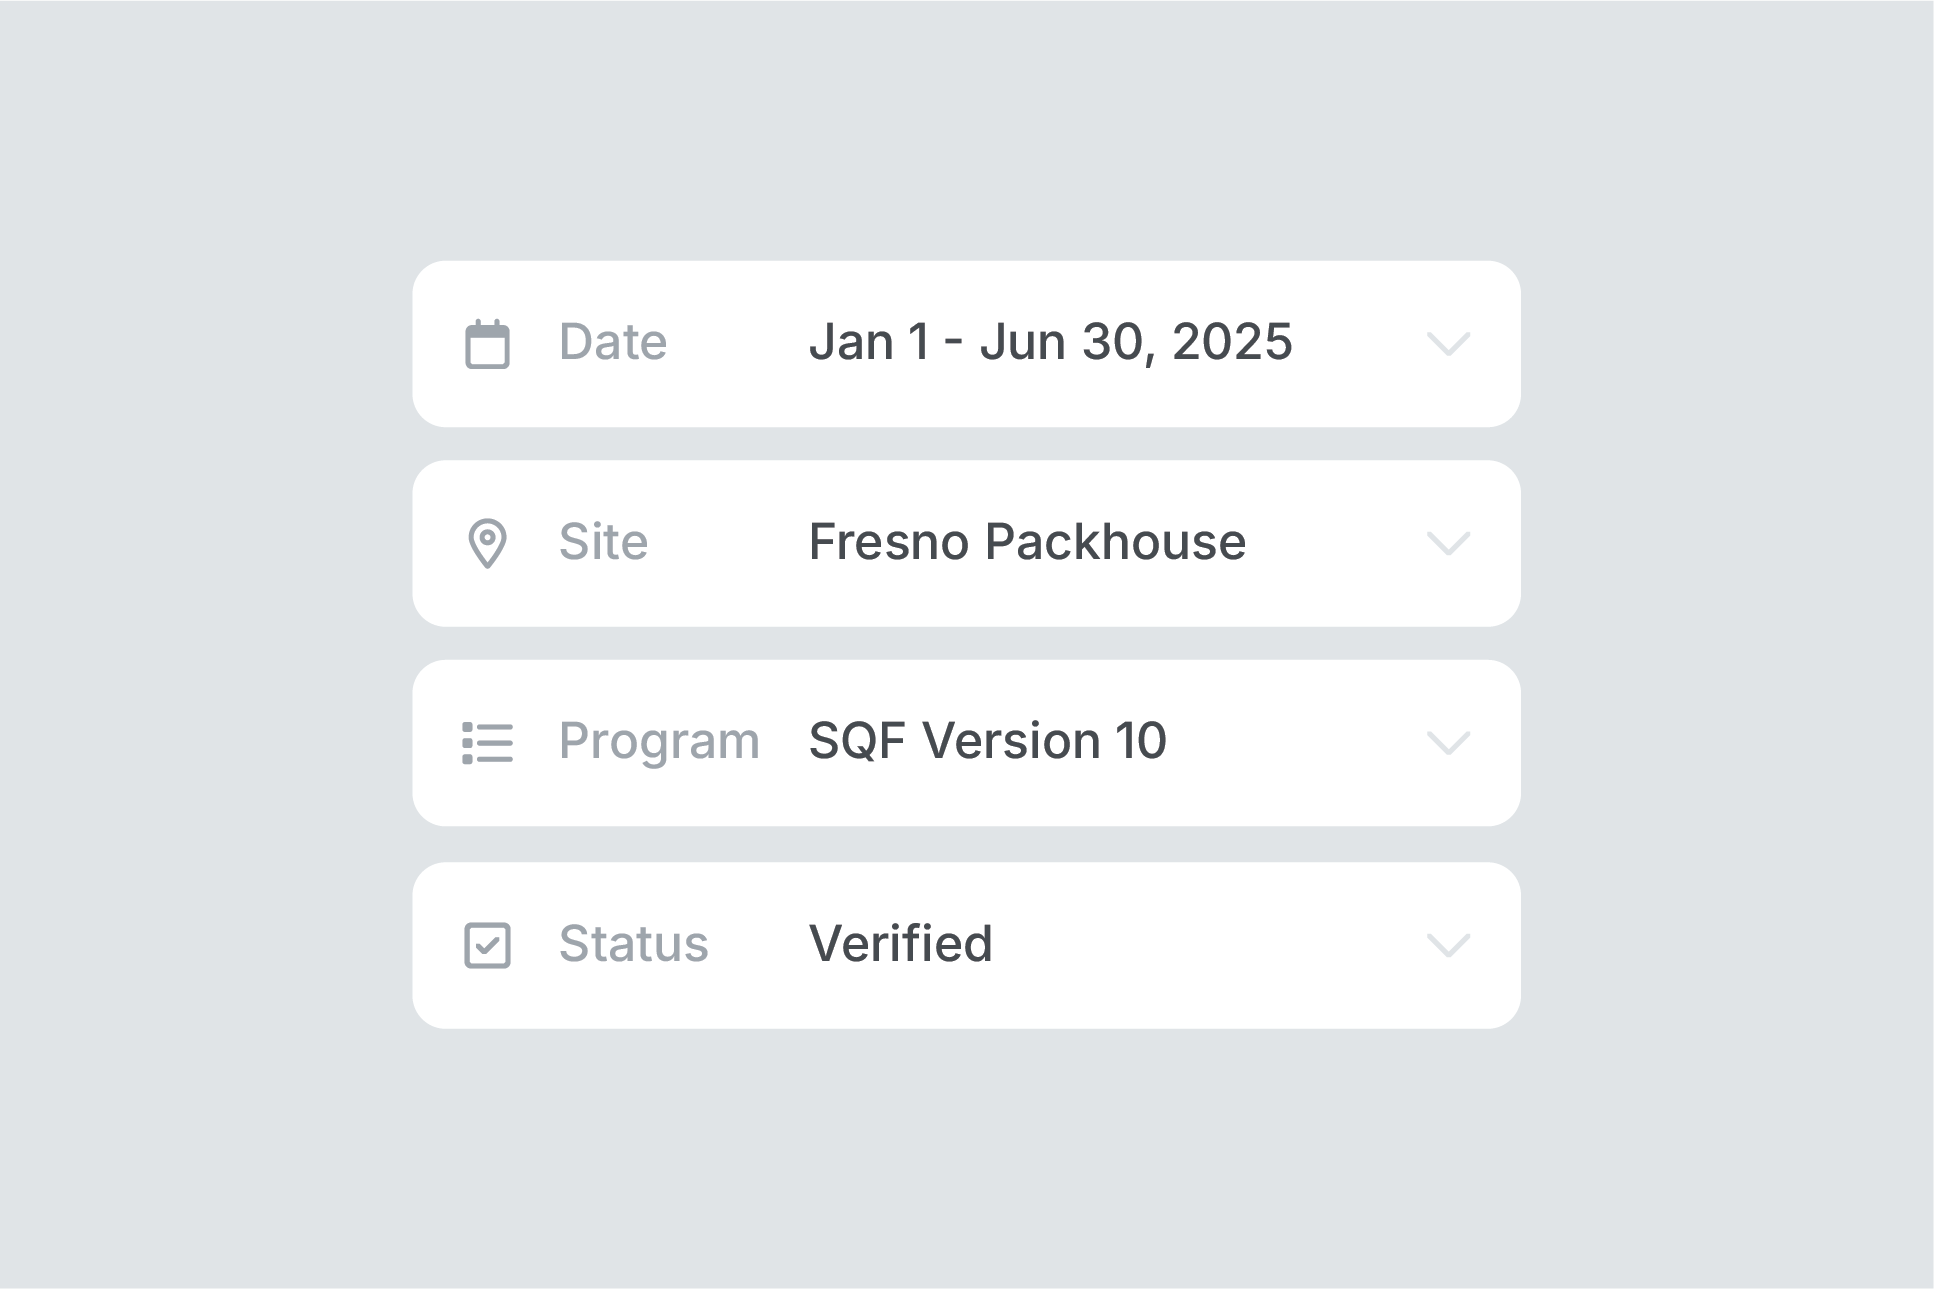
Control report contents and search for specifics
Deeper context
Go from KPI summaries to full records in one tap
“
Any sort of reporting or analytics that I want to see as the business leader, I can get instantaneously … When you have this accountability and visibility, your team takes more pride in what you do.
Track deviations and tasks with built-in dashboards – then dig deeper with custom reporting.
Controlled Permissions
Save role-specific views so each user sees only the metrics that matter to them
Configurable Insights
Build the exact report you need using simple point-and-click tools – no engineers needed
Integrated Data
Export reports as spreadsheets or sync data to BI tools with documented APIs for integration
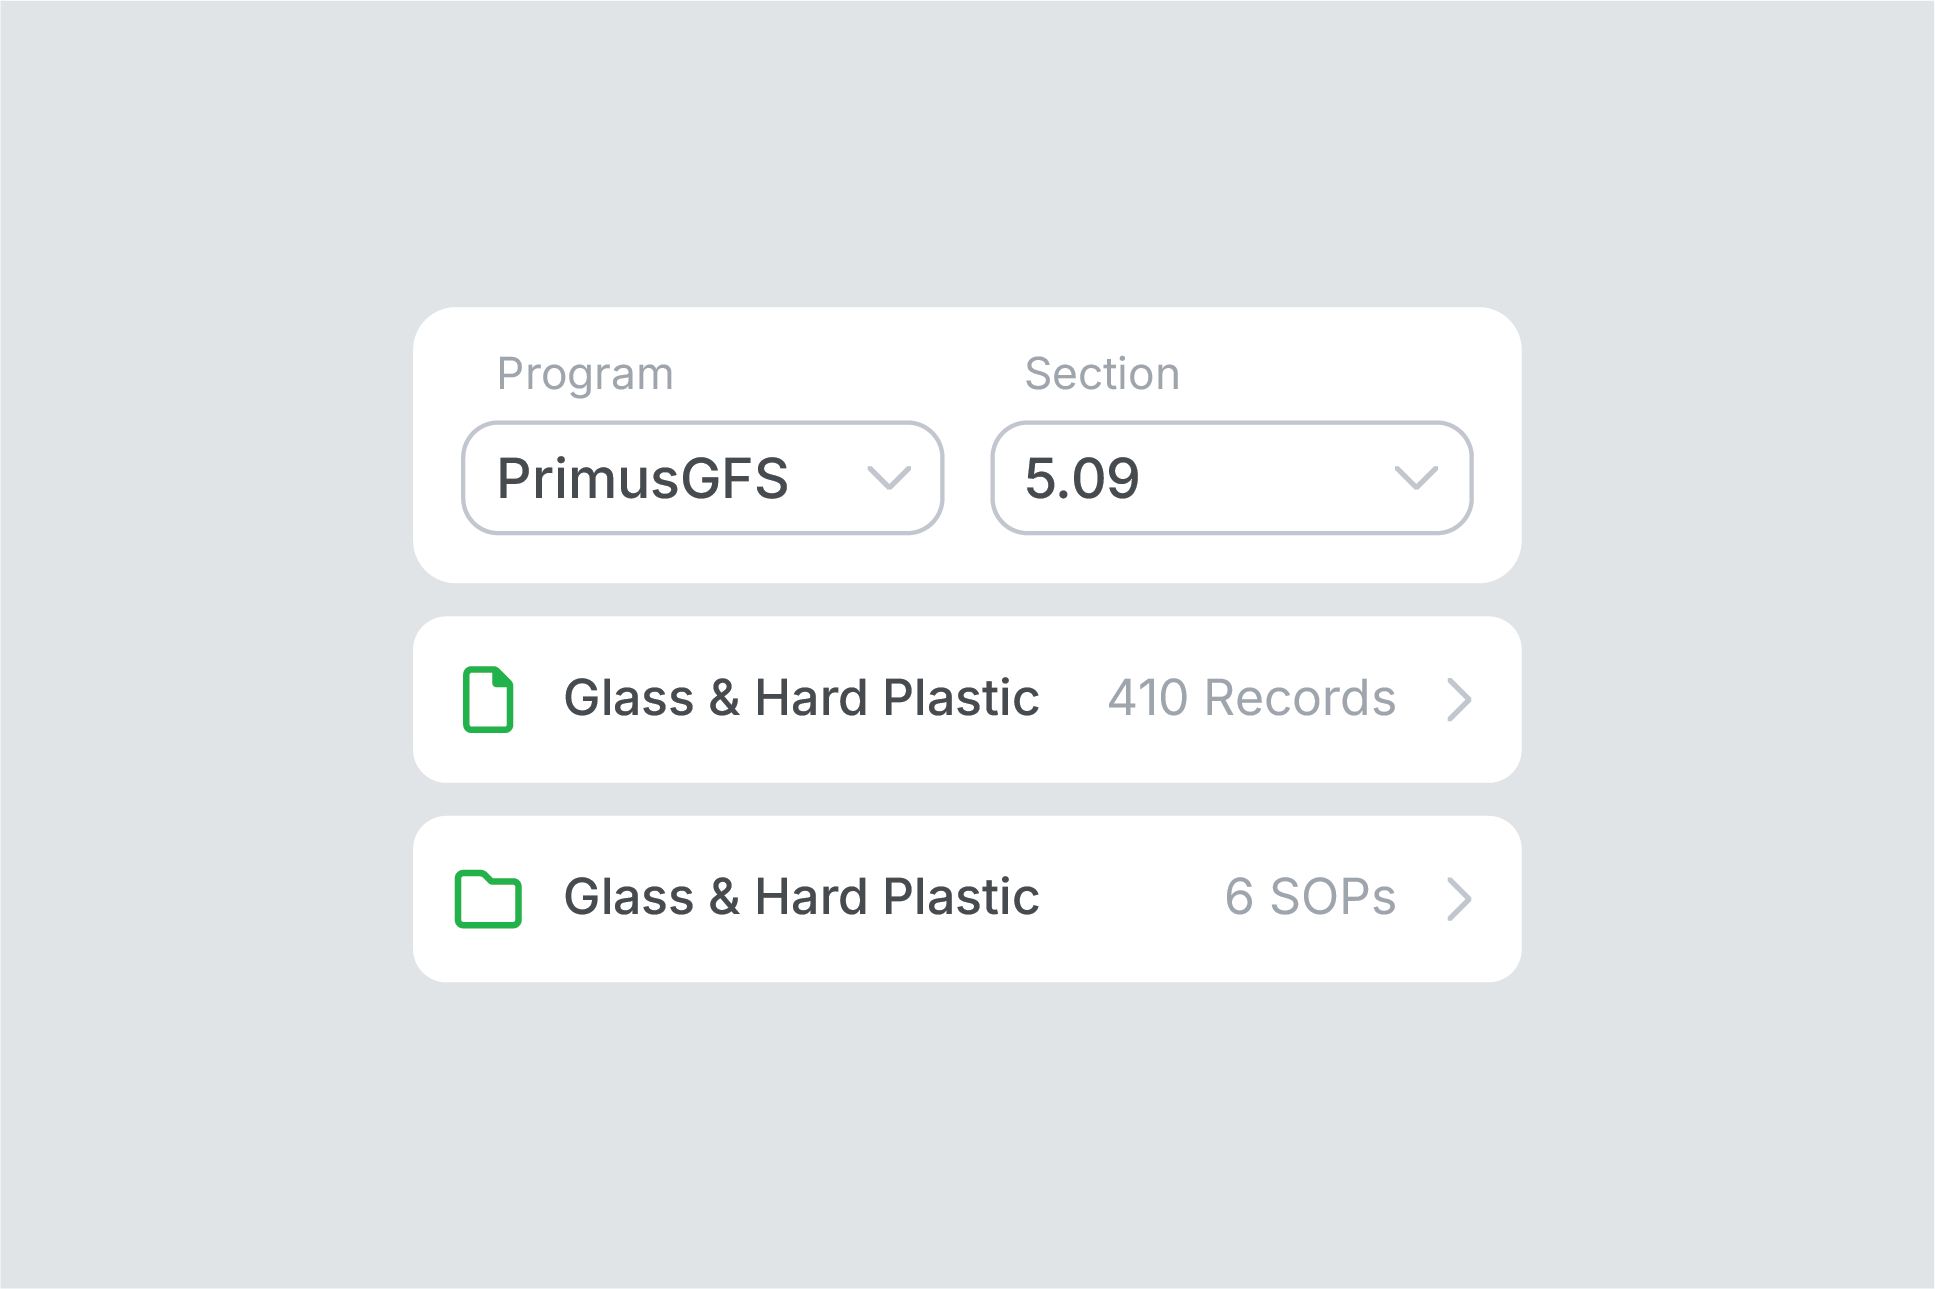
Breeze through audits.
Prep in minutes and breeze through the audit with every record ready.
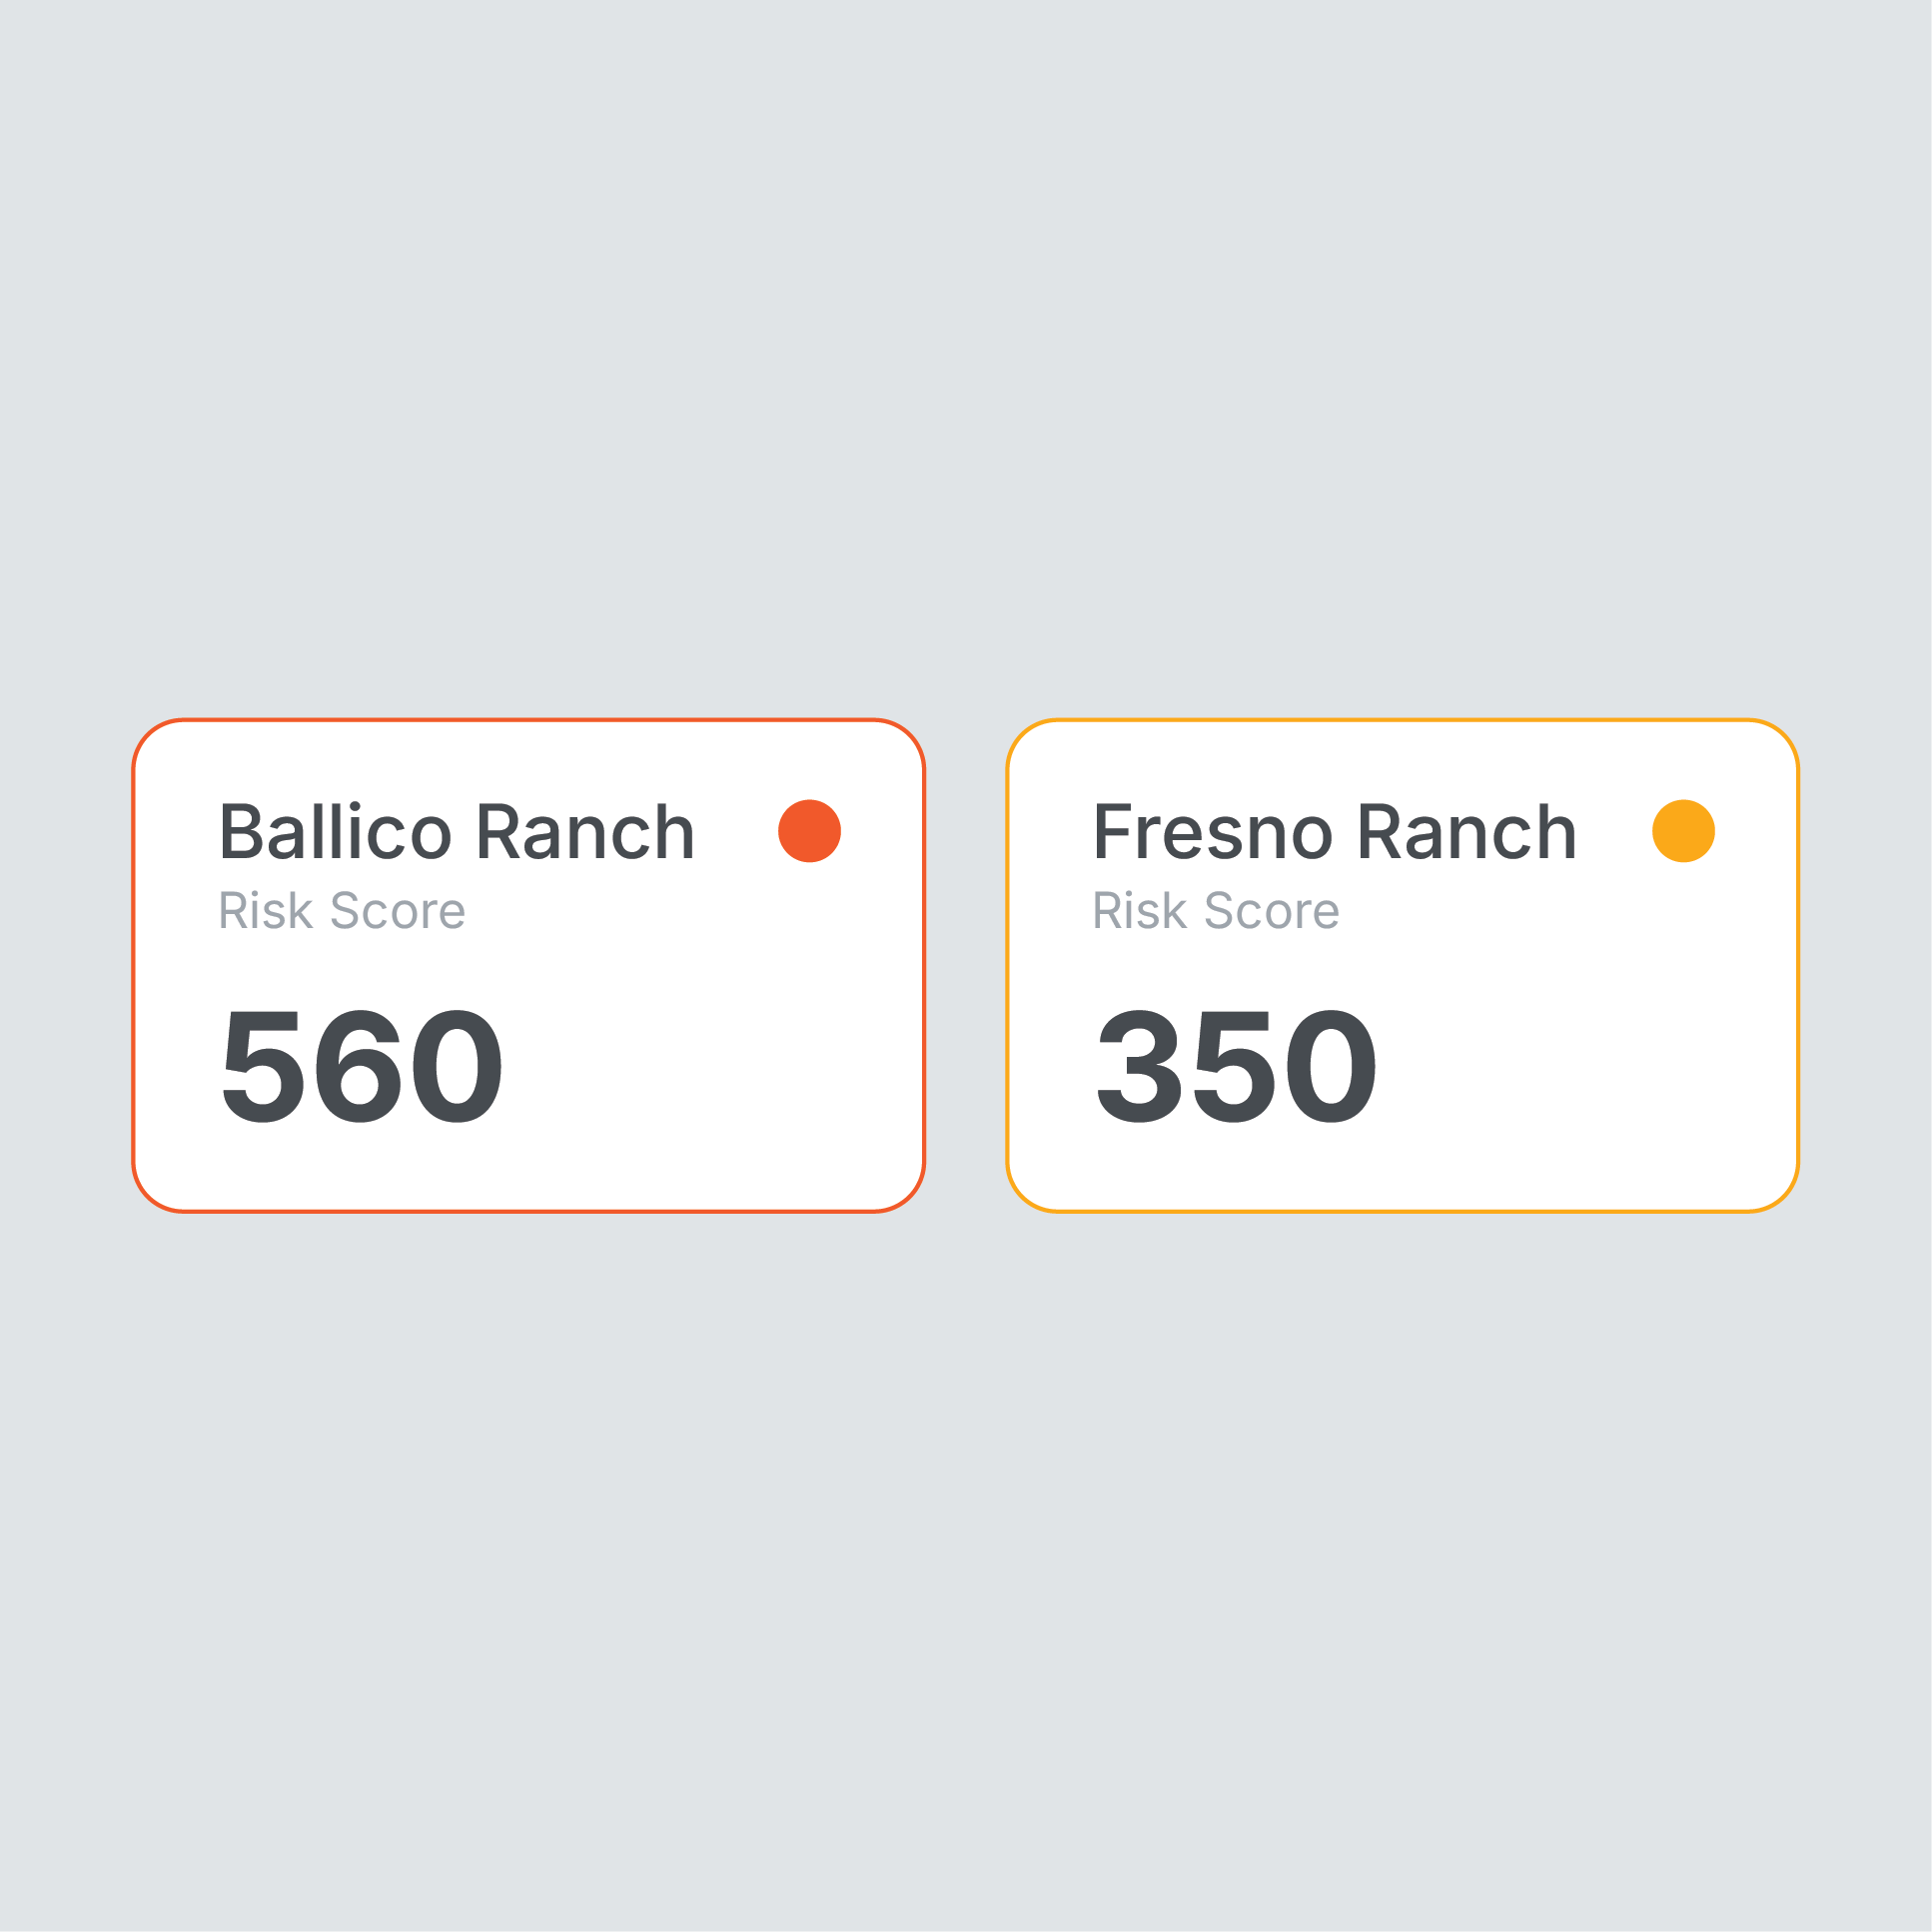
Close gaps proactively
One dashboard flags overdue records so you can fix them first
Manage auditor visibility
Give remote access for blended audits, with permission controls that protect data visibility
Pull evidence instantly
Browse records and SOPs by requirement to quickly pull evidence for any program code
Clients uncover insight and drive accountability.
The new generation of food safety leaders cuts guesswork and guides improvements with data.
“
Before, we had all of this paperwork and no way to visualize data. Now with Provision it's really quick to identify the problem areas. We know exactly what's happening and how to prevent it from recurring.
”
Parm Gill
Lineage Logistics
“
The customizable reporting and centralized data in Provision makes audits faster and more straightforward - plus it enhances our process analysis capabilities.
”
Arturo Coronado
Progressive Produce
“
We have to be able to identify trends and look at raw data analysis - and Provision really helps with that.


.png?width=1935&height=1934&name=Risk%20Trends%20by%20Severity%20for%20Food%20Safety%20Provision-min%20(1).png)


.png)