Originally delivered as a Tech Tent Talk by Provision’s Amanda Wilder, this article unpacks how to turn scattered food-safety records into actionable metrics. Learn why traditional audit grades can mask emerging threats, which data streams to tap, and how to weight, automate, and socialize Risk Scoring so operators, managers, and executives all act on the same clear signal.

Most facilities judge success by GFSI or health-department numbers. Yet high marks can hide problems if the metrics don’t capture day-to-day reality.
-
Complacency RiskLeadership assumes funding isn’t needed when audits look flawless
-
Siloed DataMaintenance logs, near-miss reports, or supplier complaints often sit outside the audit scope
-
Missing PiecesIssues don't wait for an audit to arise; one site battled three months of spoilage before maintenance records revealed a root-cause temperature fault — an issue the audit never flagged
.png?width=1920&height=1280&name=Risk%20Scoring%20Fresh%20Produce%20Provision%20Analytics%20Food%20Safety%201-min%20(1).png "Risk Scoring Fresh Produce Provision Analytics Food Safety 1-min (1)")
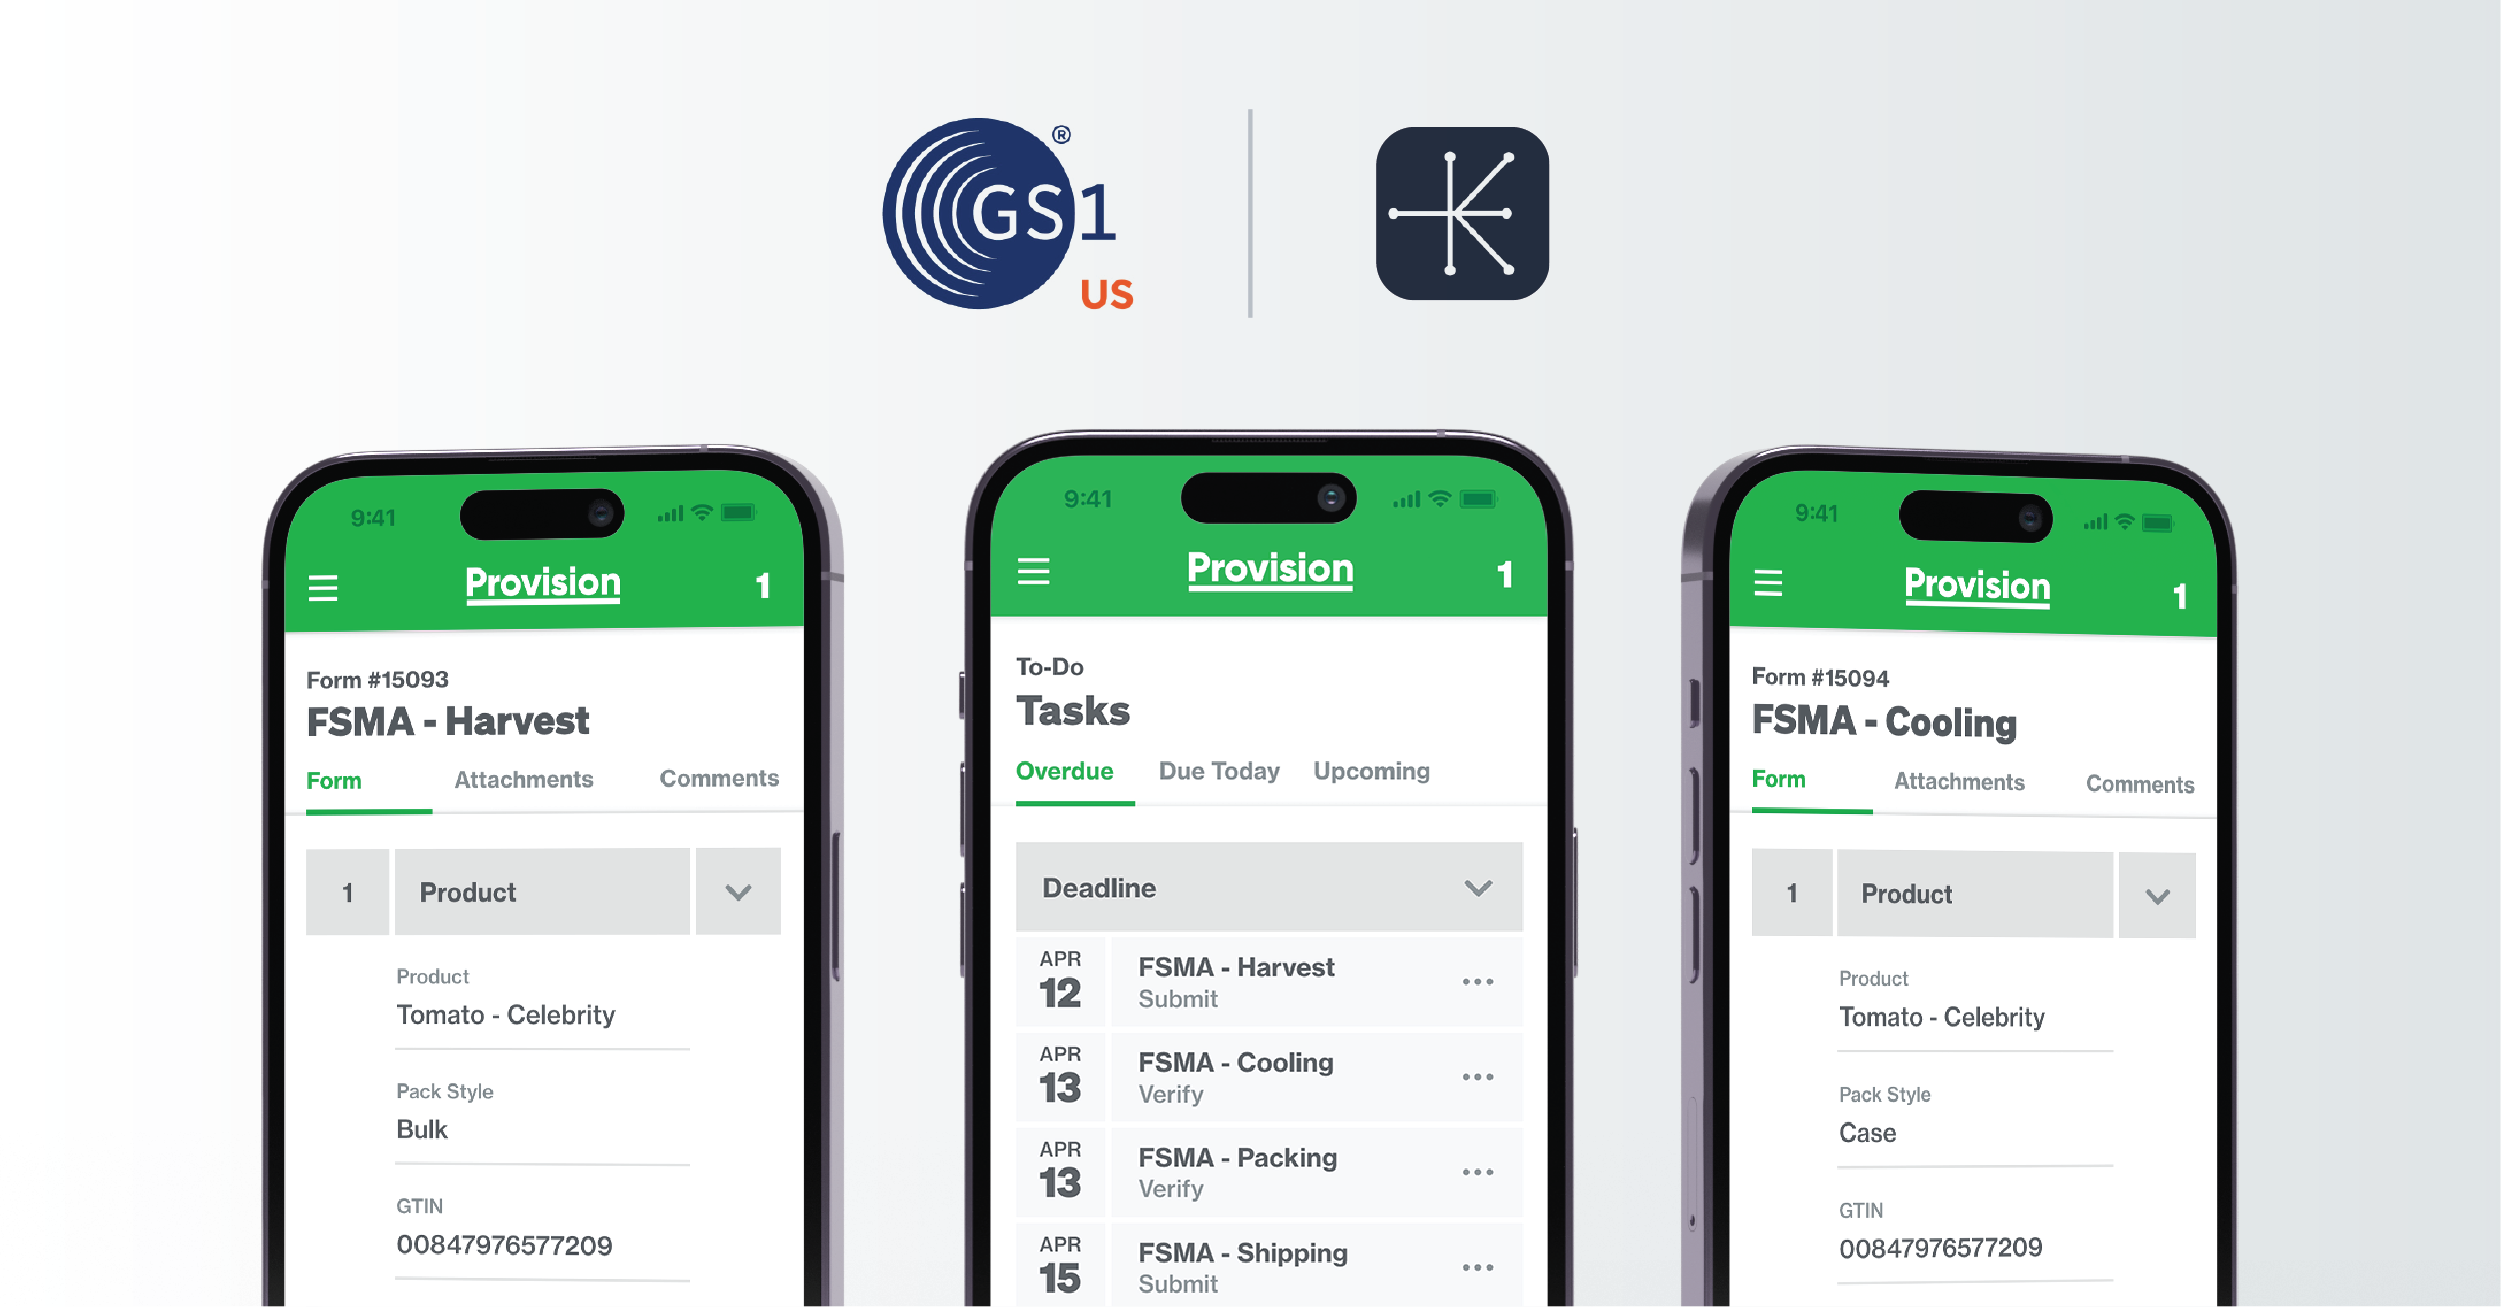
To get proactive, flip the lens from “passing an audit” to “seeing trends before they bite.” We recommend factoring in these data sources:
-
Internal Operations
CCP checks, sanitation, equipment maintenance, staff training -
Integrated Data
Third-party lab results and customer audit findings -
External Signals
FDA and USDA recall alerts, industry outbreak reports
Combining internal, integrated, and external data uncovers correlations that no single source could reveal on its own. By distilling those blended signals into one composite metric, every department can recognize a sudden spike and discuss it in a shared, plain-language framework.
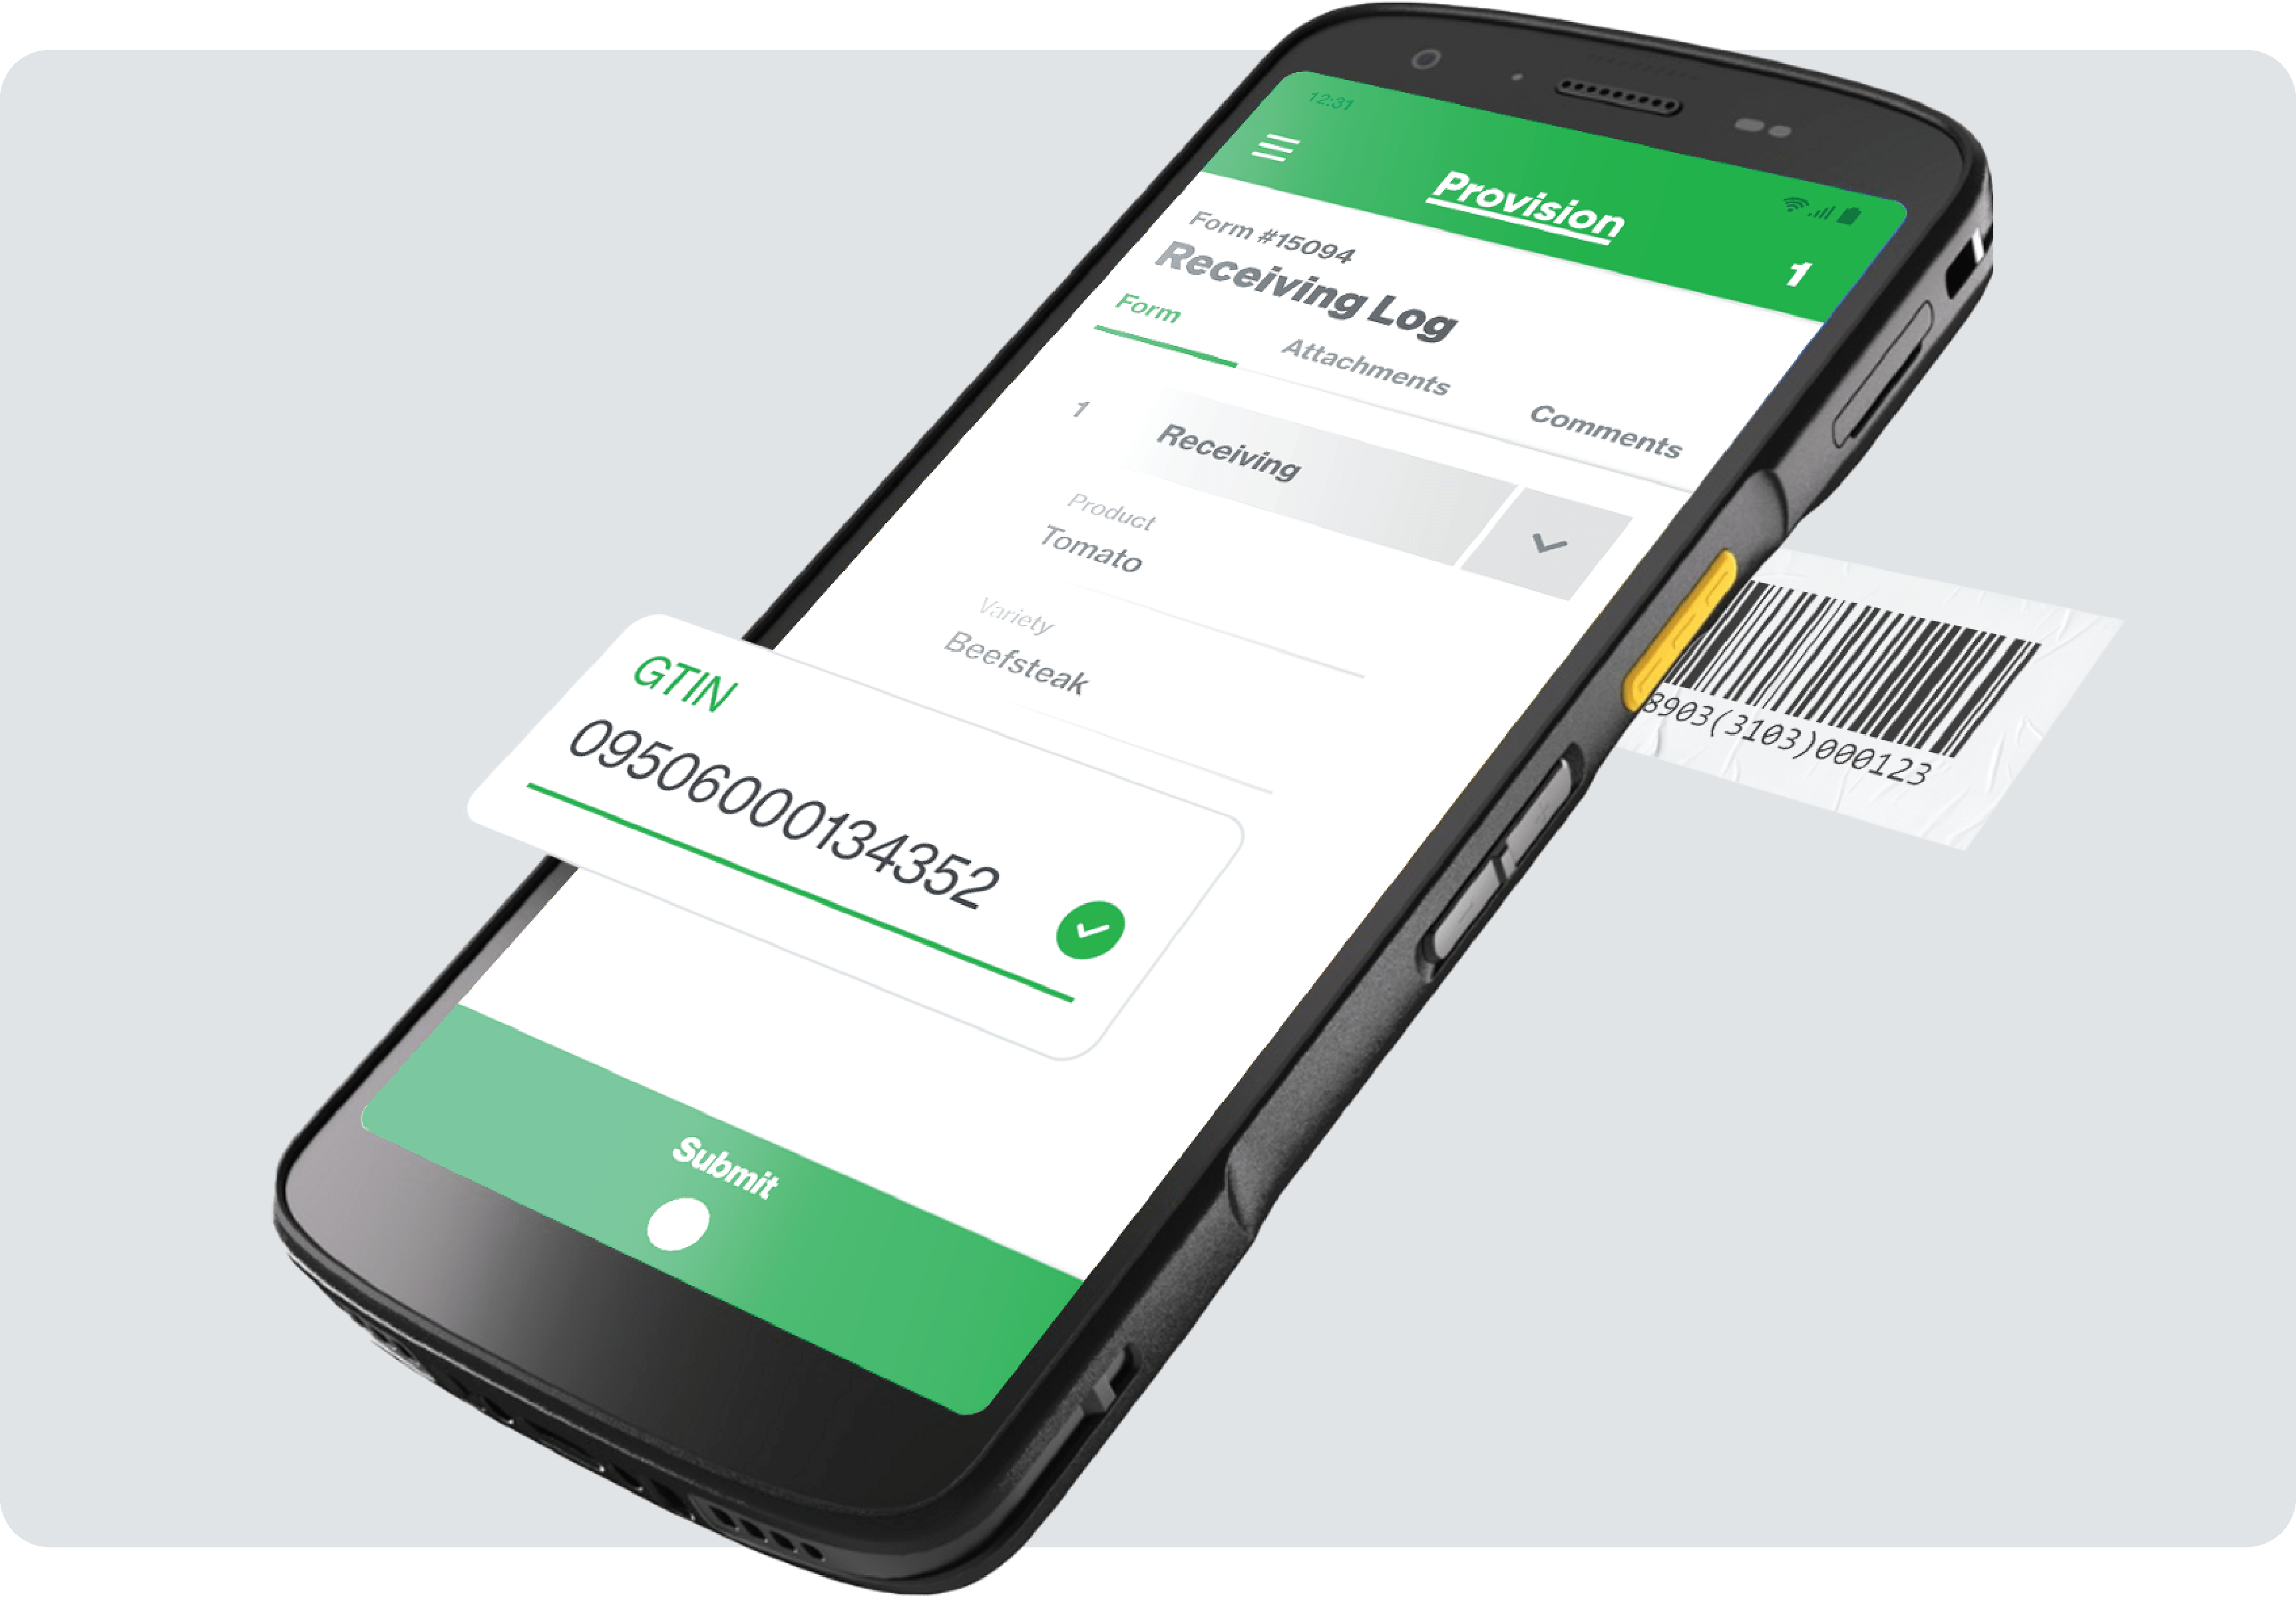
A reliable risk score lives or dies on data quality. Manual spreadsheets break down under real-world pressure, and create extra work with brittle formulas and repetitive data entry. Purpose-built FSQA records can leverage live data from the floor to unlock risk scoring
There are four recommendations to ensure clean, compliant data for Risk Scoring:
-
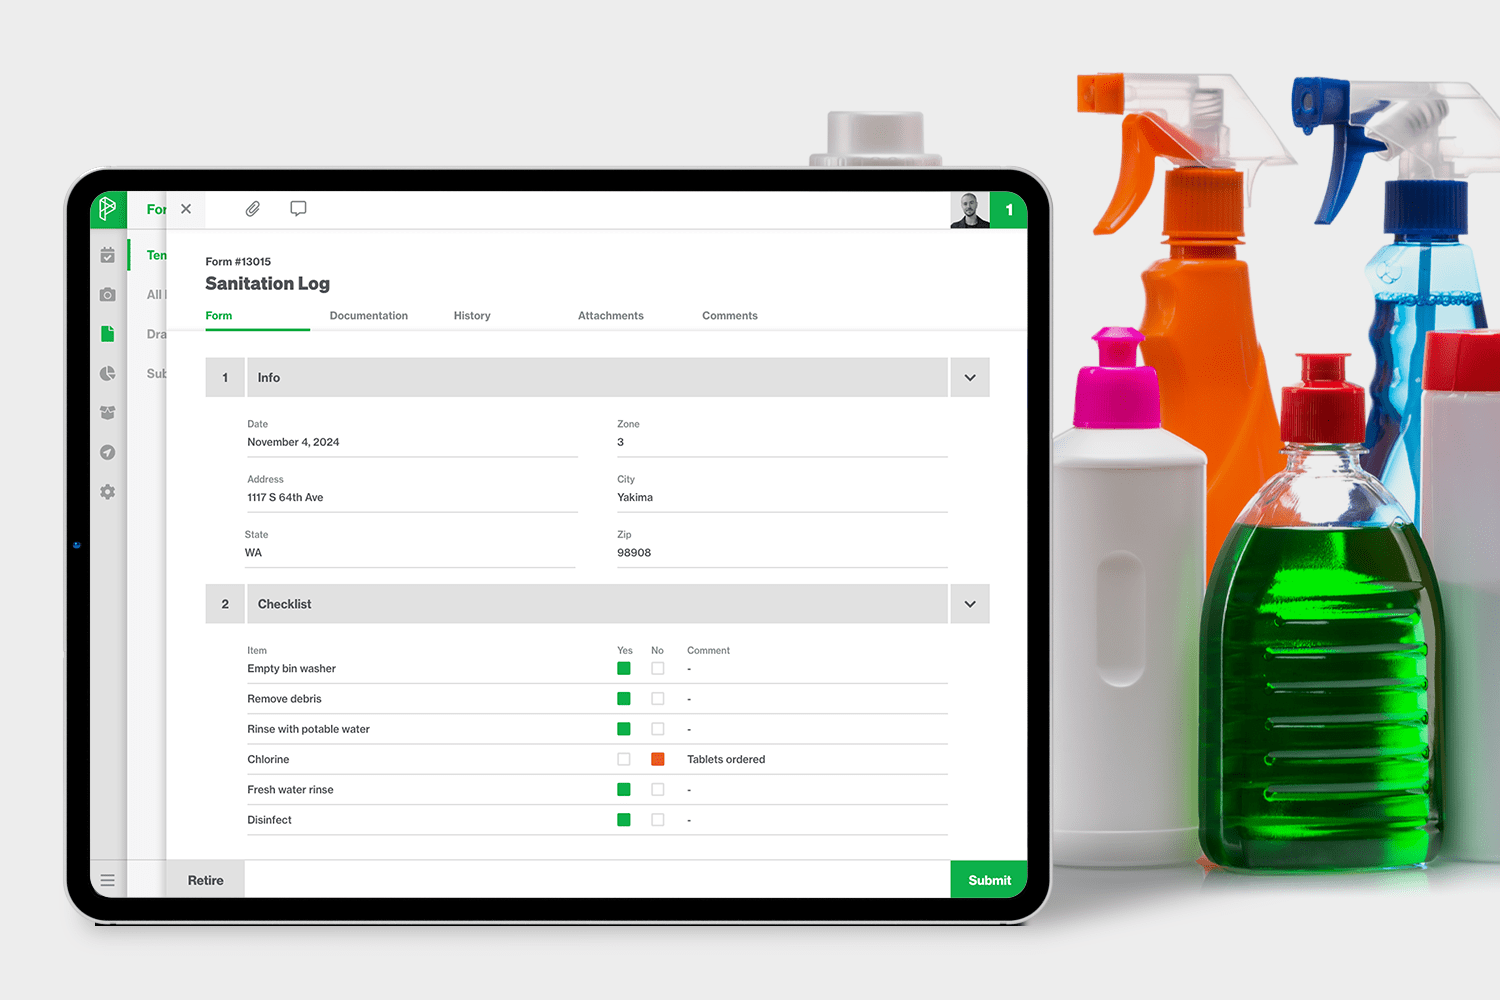
No MissesGenerate live reminders in clear tasks to prevent forgotten records that skew risk results
-
No Mistaken EntriesDeliver live SOP guidance inside records to ensure that data accurately represents process steps
-
No MisreadsEnable live translation inside records, supporting clear data entry for multi-cultural staff
-
No ReworkUse smart rules to flag incomplete and non-compliant data on the spot, ensuring that every finding is true and reliable
Thoughtfully considering the inputs and method of scoring risk is key to achieving an automated feedback system. Avoiding the pitfall of Goodhart’s Law is also important; metrics shouldn’t be used as a target to aim for, but a vital sign to monitor and manage directional changes.
-
Count IncidentsStructure records to automatically log every missed task and every deviant finding in records
-
Multiply by SeverityAutomatically assign a multiplier to more series incidents – for example, a CCP miss > warehouse GMP lapse, or a Zone 1 listeria presumptive > Zone 4
-
Build ContextDivide weighted incidents by the number of submissions to gauge the prevalence of non-conformance
-
Measure RiskDevelop a scoring scale - not a percentage out of 100 - that encourages the discovery of incidents and demystifies continuous improvement

Team Processes for Risk Scoring
Risk Scoring succeeds only when every role consults the same meter. Treat the composite score as your shared vocabulary—then resist the urge to slip back into lab acronyms or audit jargon that confuse the message. Display the score over time and across locations so teams can benchmark in context, and always break the total into clear categories (e.g., Pathogens, Near Misses, CCP Compliance). Those buckets become the first, intuitive drill-down path to fix what matters most.
-
OperatorsReview risk scores at shift changes to ensure awareness, driving focus and accountability
-
Plant ManagersReview trends and root causes weekly to inform operator coaching and procedure updates
-
ExecutivesReview risk scores monthly with a summary of budget asks and prior investment results
Conclusion: Proactive Cultures Beat Reactive Firefighting
Risk Scoring converts scattered records into one early-warning signal, guiding teams to intervene long before minor deviations escalate. By giving everyone—from operators to executives—the same plain-language metric, it sharpens budget conversations and keeps day-to-day focus on the right priorities. Track that score over time and across sites, refine the weighting as your business evolves, and you’ll replace reactive firefighting with a culture of continuous, data-driven improvement.